
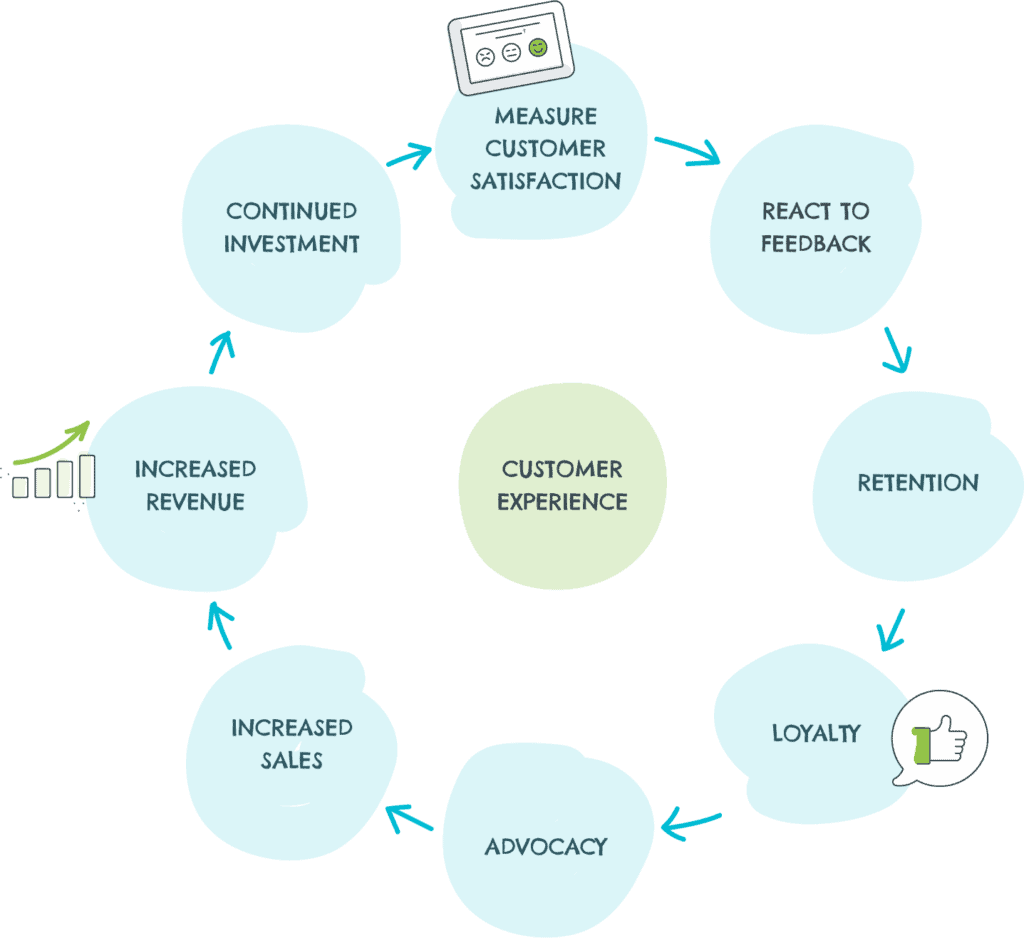
MEASURE CUSTOMER EXPERIENCE
Customer experience is no different to most business expenses, in that senior leaders want to see a return on investment. CX leaders need to build a business case to gain, keep or increase investment. Before you can quantify the return of your CX programme, you need to measure customer satisfaction. Understand your customers experience throughout their journey, collecting data at every touchpoint.
ROI METRICS
Given that CX is still a relatively new function for many organisations, it’s surprising that 48% of companies have already calculated a positive link*, according to Gartner.
A customer experience metric should measure a customer benefit, if it isn’t of value to your customers it’s not a CX metric. Financial results are more long-term goals and CX teams sometimes struggle to prove the return in investment in the short-term.
However, you shouldn’t be tempted to focus on financial results alone, you can’t become a customer-centric business by concentrating purely on monetary outcomes.
AGREE METRICS
It’s not just CX teams who should be concerned with customer experience, almost every department is involved and they’ll be interested in different objectives and insights.
Marketing usually own customer retention, Customer Service manage response and resolution, Sales focus on acquisition and onboarding processes, Product Development need to know how well new products or features are received, Operations will look at efficiencies and delivery timeliness, IT are responsible for systems used by customers, and HR are interested in employee engagement and turnover. All of these feed into customer experience.
1. CUSTOMER SATISFACTION SCORES
Start with the Voice of Customer (VOC) scores; CSAT, NPS and CES. You might collect one, two or all three of these as they all provide different insights. But they’ll all help to understand how satisfied your customers are, or not.
CSAT (Customer Satisfaction) Score measures satisfaction at that point in time, a specific interaction, product or area of your business.
NPS (Net Promoter Score®) is a standardised question to gauge how likely your customers are to recommend you, also giving an indication of how loyal they are. As it’s an industry standard it enables you to benchmark against yourself and competitors.
CES (Customer Effort Score) is a standardised question to find out how easy it was for them to do something. Research shows if you can solve their requirements quickly and easily, you’ll improve satisfaction and loyalty.
None of these scores alone prove that a customer will return or recommend you, but together with insights from customer feedback and other KPIs you should be able to report a positive business impact.
2. KEY PERFORMANCE INDICATORS (KPIs)
KPIs such as, retention rates, customer advocacy, customer lifetime value, acquisition by source (word of mouth) can be calculated retrospectively. They are a good indication of loyalty, the likelihood of retaining that customer and of them recommending you to friends and family.
3. OUTCOMES OF INSIGHTS
As well as reporting on scores and data alone you should also report on the outcome of actions you’ve taken on insights received. If you’ve made product, operational or resource enhancements based on customer feedback or insights, follow these up and track any improvement in customer satisfaction and other metrics.
You should also measure any gestures of goodwill such as free tickets, memberships or subscriptions, product replacements and refunds. These can directly affect customer satisfaction and loyalty, and should be easy to track.
4. EMPLOYEE ENGAGEMENT
Data, and logic, tells you that happy employees create satisfied customers. Although it’s not a CX measure if you really want to put customers at the heart of your business you also need to measure and improve employee experience. You can use CX data insights to help optimise staffing costs by understanding peak times, and when and where to focus resources.
5. FINANCIAL RESULTS
In the long-term you should be able to measure a return on investment. Compare customer satisfaction metrics, KPIs and anecdotal evidence against financial results such as number, value and frequency of sales.
SUMMARY
To make your customer experience initiative a success you need to put customer centricity in the spotlight and resist the temptation to fixate entirely on ROI.
CHECKLIST OF USEFUL METRICS
Many large organisations have around 50 CX metrics, with some having up to 200! You don’t need to jump to these levels, it’s different for every business. However, those listed below are a good place to start:
- CSAT (Customer Satisfaction) Score
- NPS (Net Promoter Score)
- CES (Customer Effort Score)
- Mystery Shopper Scores
- Reviews and Ratings
- Customer Engagement
- Employee Engagement
- Customer Service Calls – Number, length and frequency
- Response and Resolution – Time and cost
- Retention Rate
- Repeat Business
- CLTV (Customer Lifetime Value)
- Advocacy/Referrals
- New Business
- Cost of Acquisition
- Revenue and Profitability
By Caroline Hawksworth
*Gartner’s 2017 Customer Experience in Marketing Survey

